Line dashboards
Production dashboards for the TV above the line
Every line gets a wall display that shows what it is building, how many units are done and whether it is ahead of pace. The numbers come from what the stations record, so nobody updates a whiteboard and the screen can be read from across the floor.
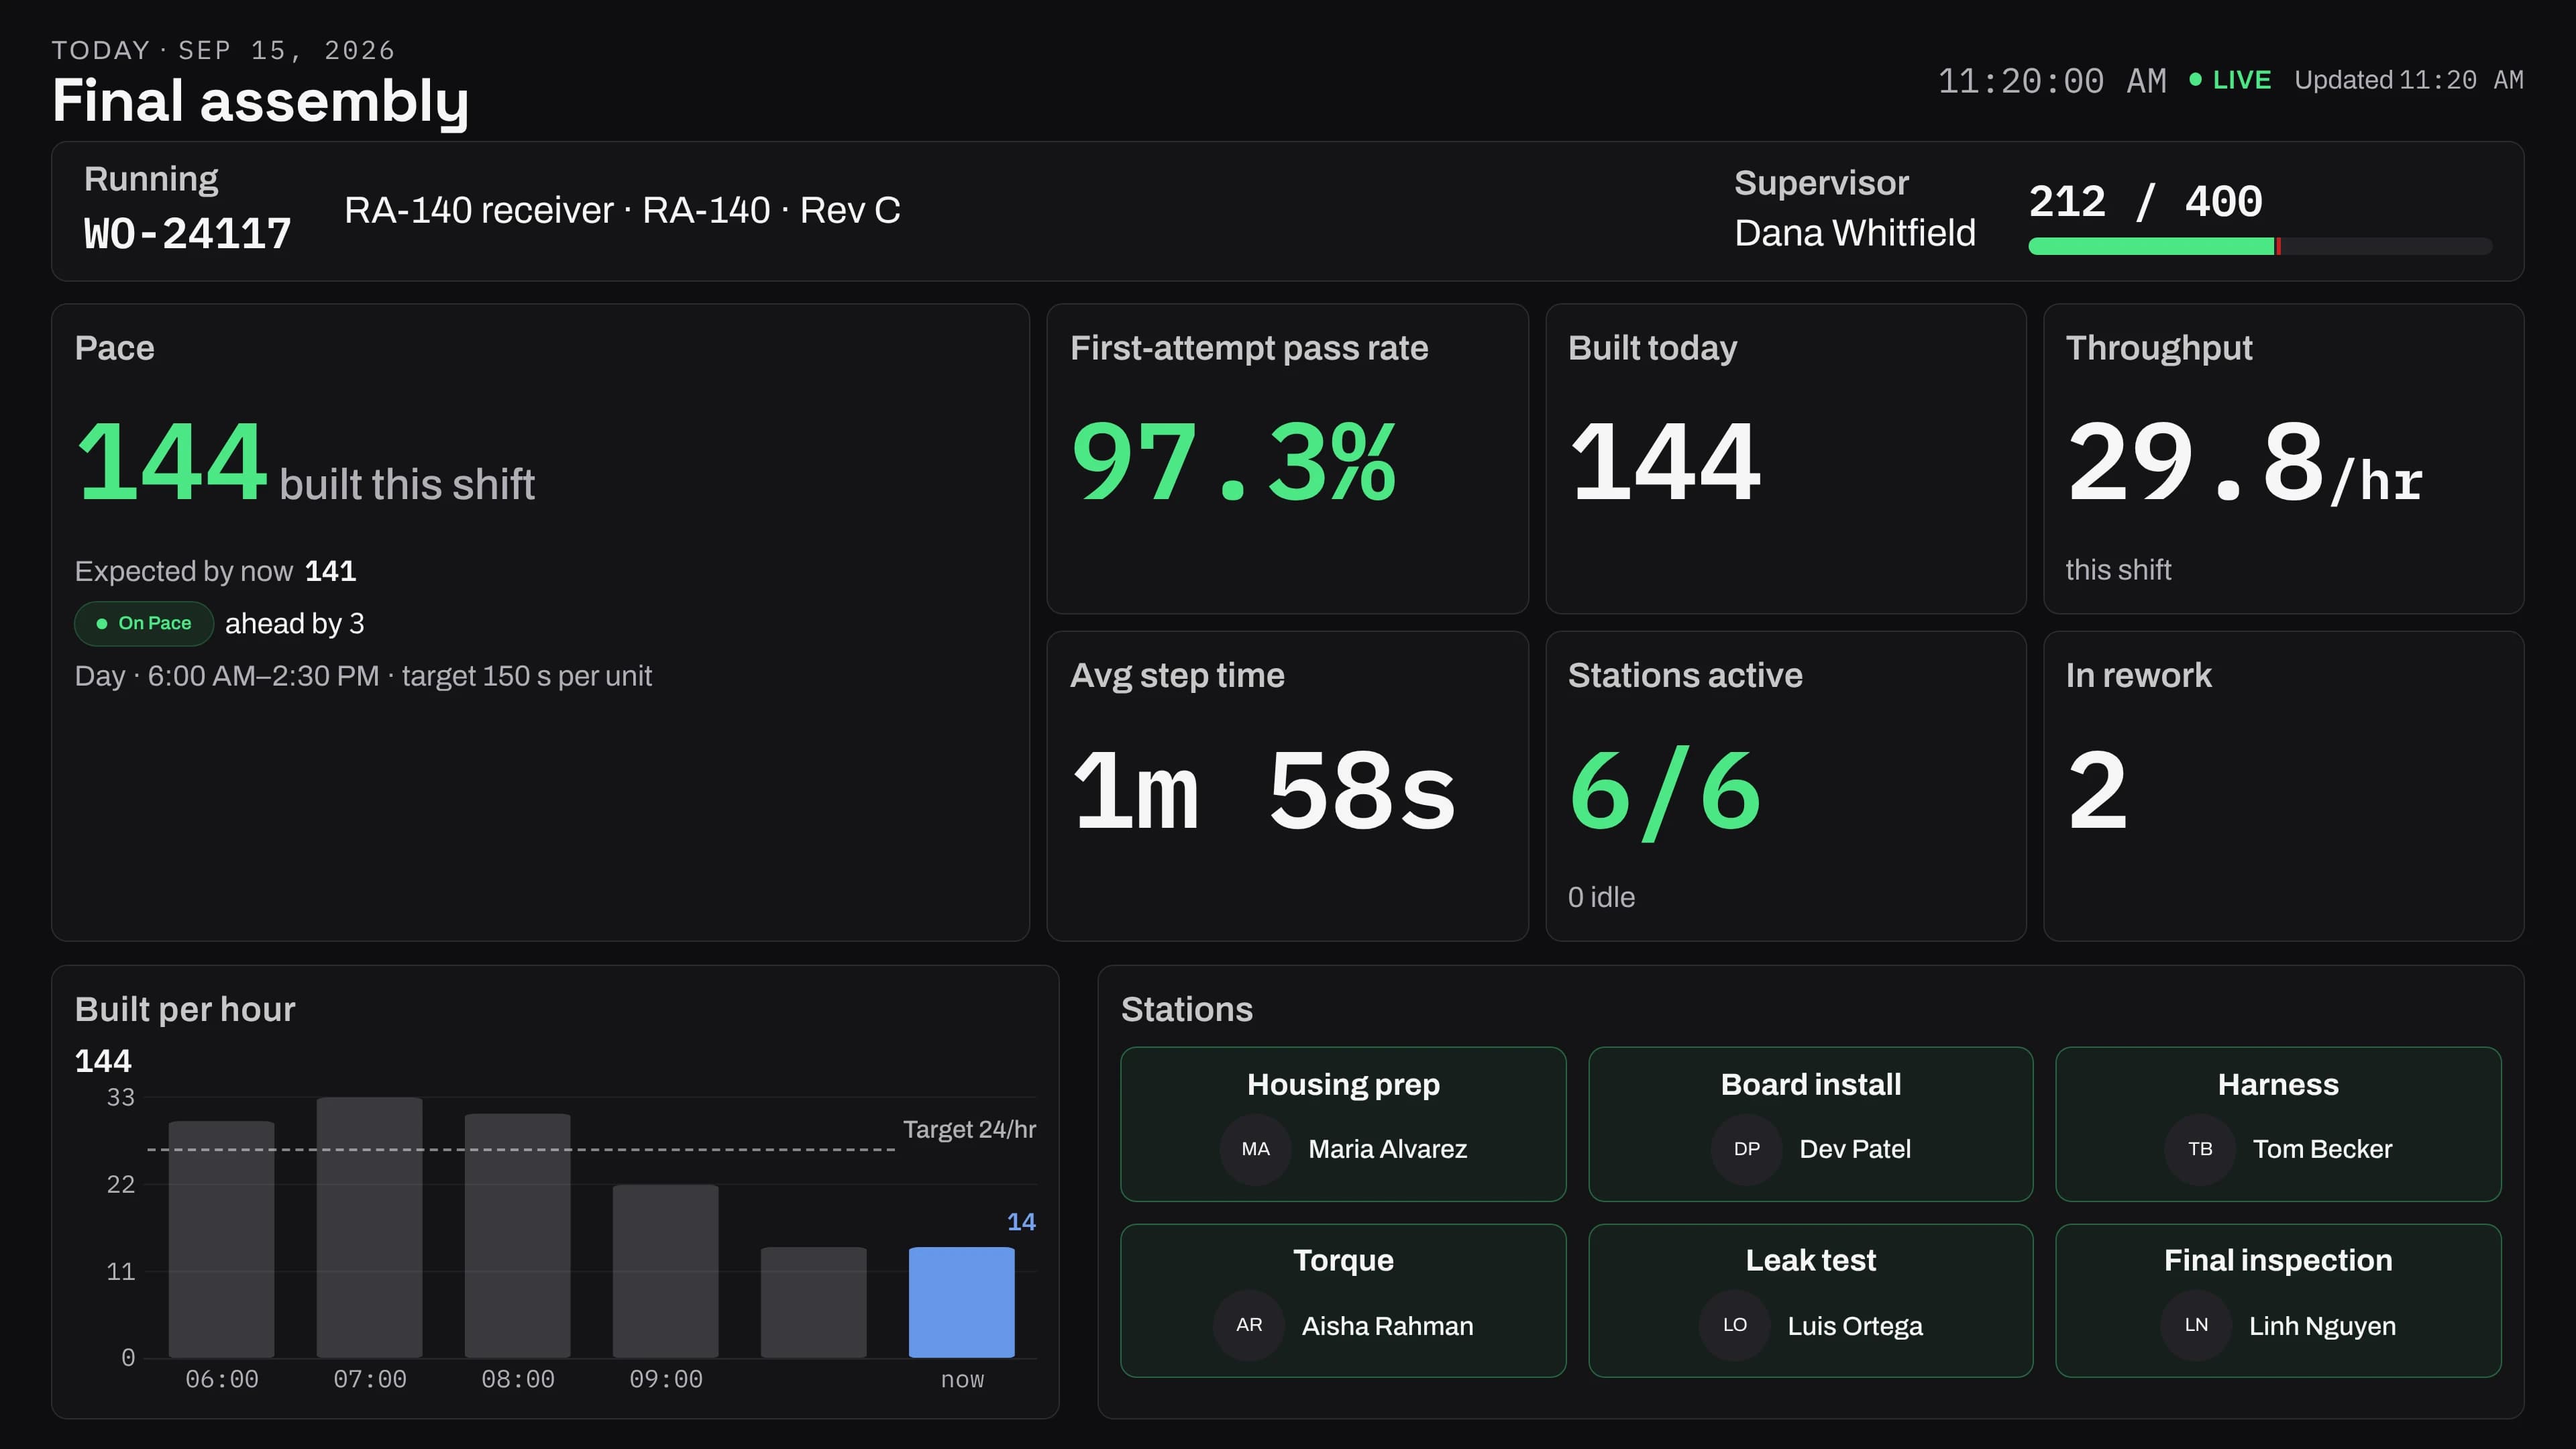

What the line display shows
The work order the line is building, with units passed against the quantity ordered. Pace, built against expected by now. Output per hour against the target, the first-attempt pass rate, units in rework, and who is badged in at each station.
It refreshes about every 30 seconds and needs no one to touch it. If the network drops, the screen keeps the last figures and says when they were updated.
Any TV with a browser
A smart TV's browser or a browser stick. Open the line's display, choose Enter fullscreen and leave it.
Display hours
Run the displays around the clock or only during set hours in your company's time zone.
One line per screen
Each line has its own address, so you can bookmark it on the TV and it opens straight to that line.
Pace that knows about breaks and changeovers
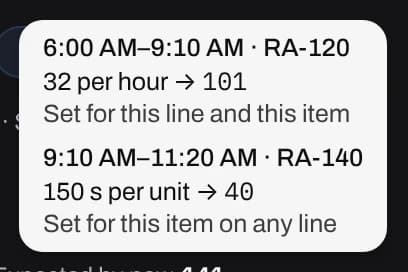
Set a target for a line, a shift, an item or a model, as units per shift, units per hour or seconds per unit. Pace counts working time only, so nothing is expected during a break.
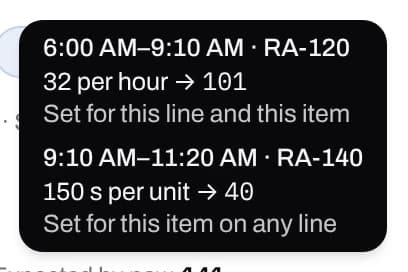
When the line switches products partway through a shift, each part of the shift is held to the rate for what was running. Hover the figure to see the sum, line by line.
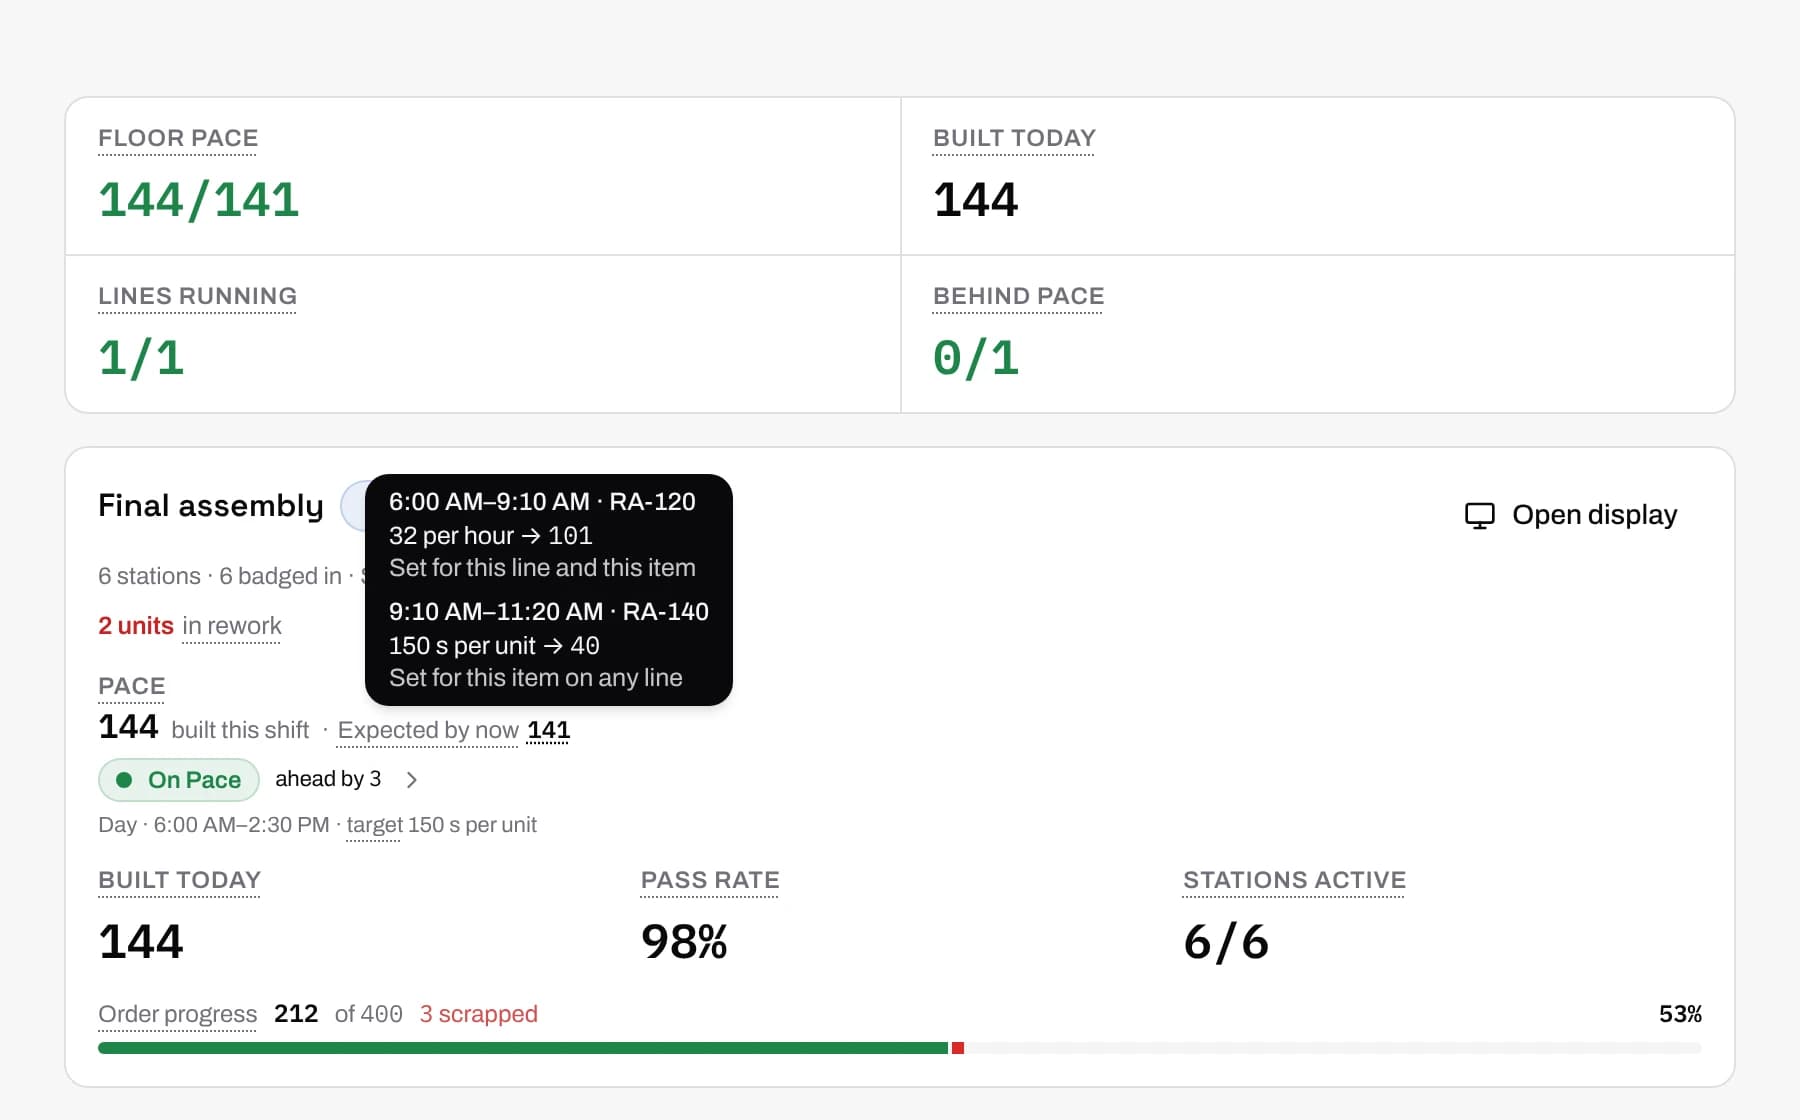
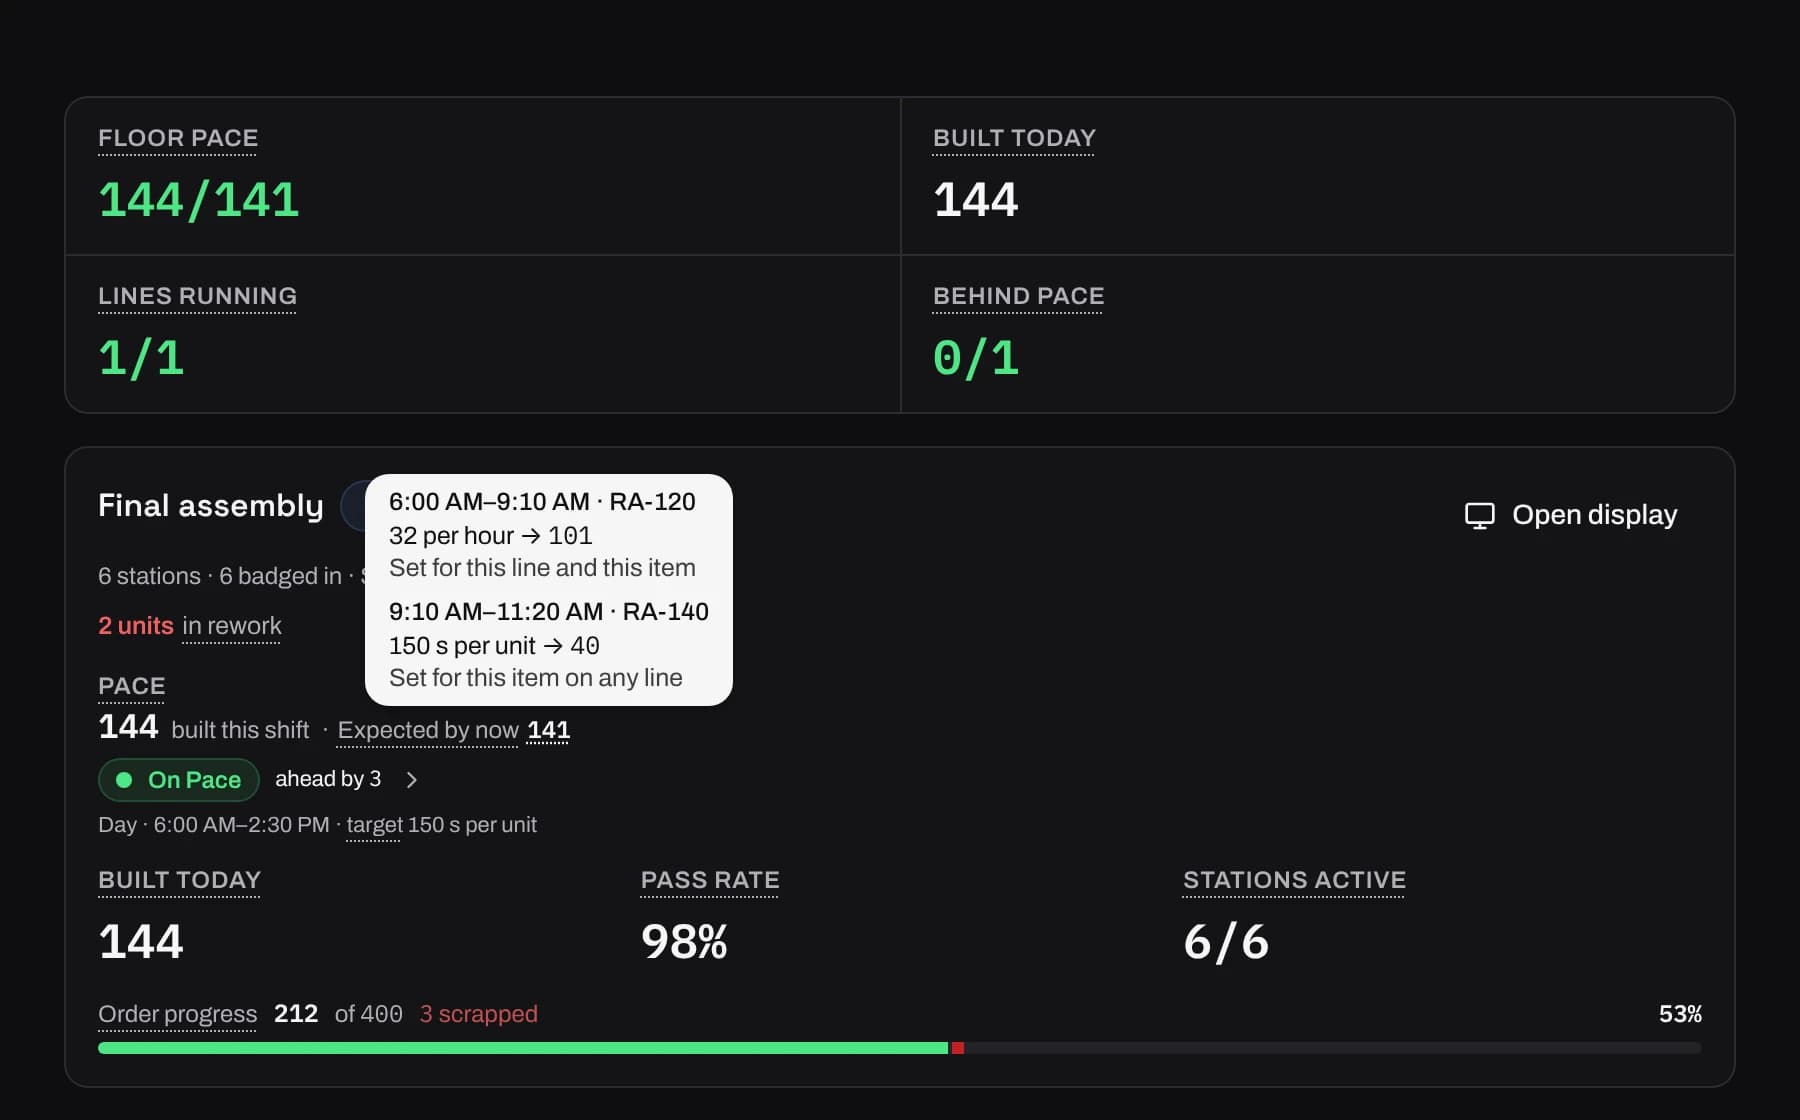
Today: every line on one page
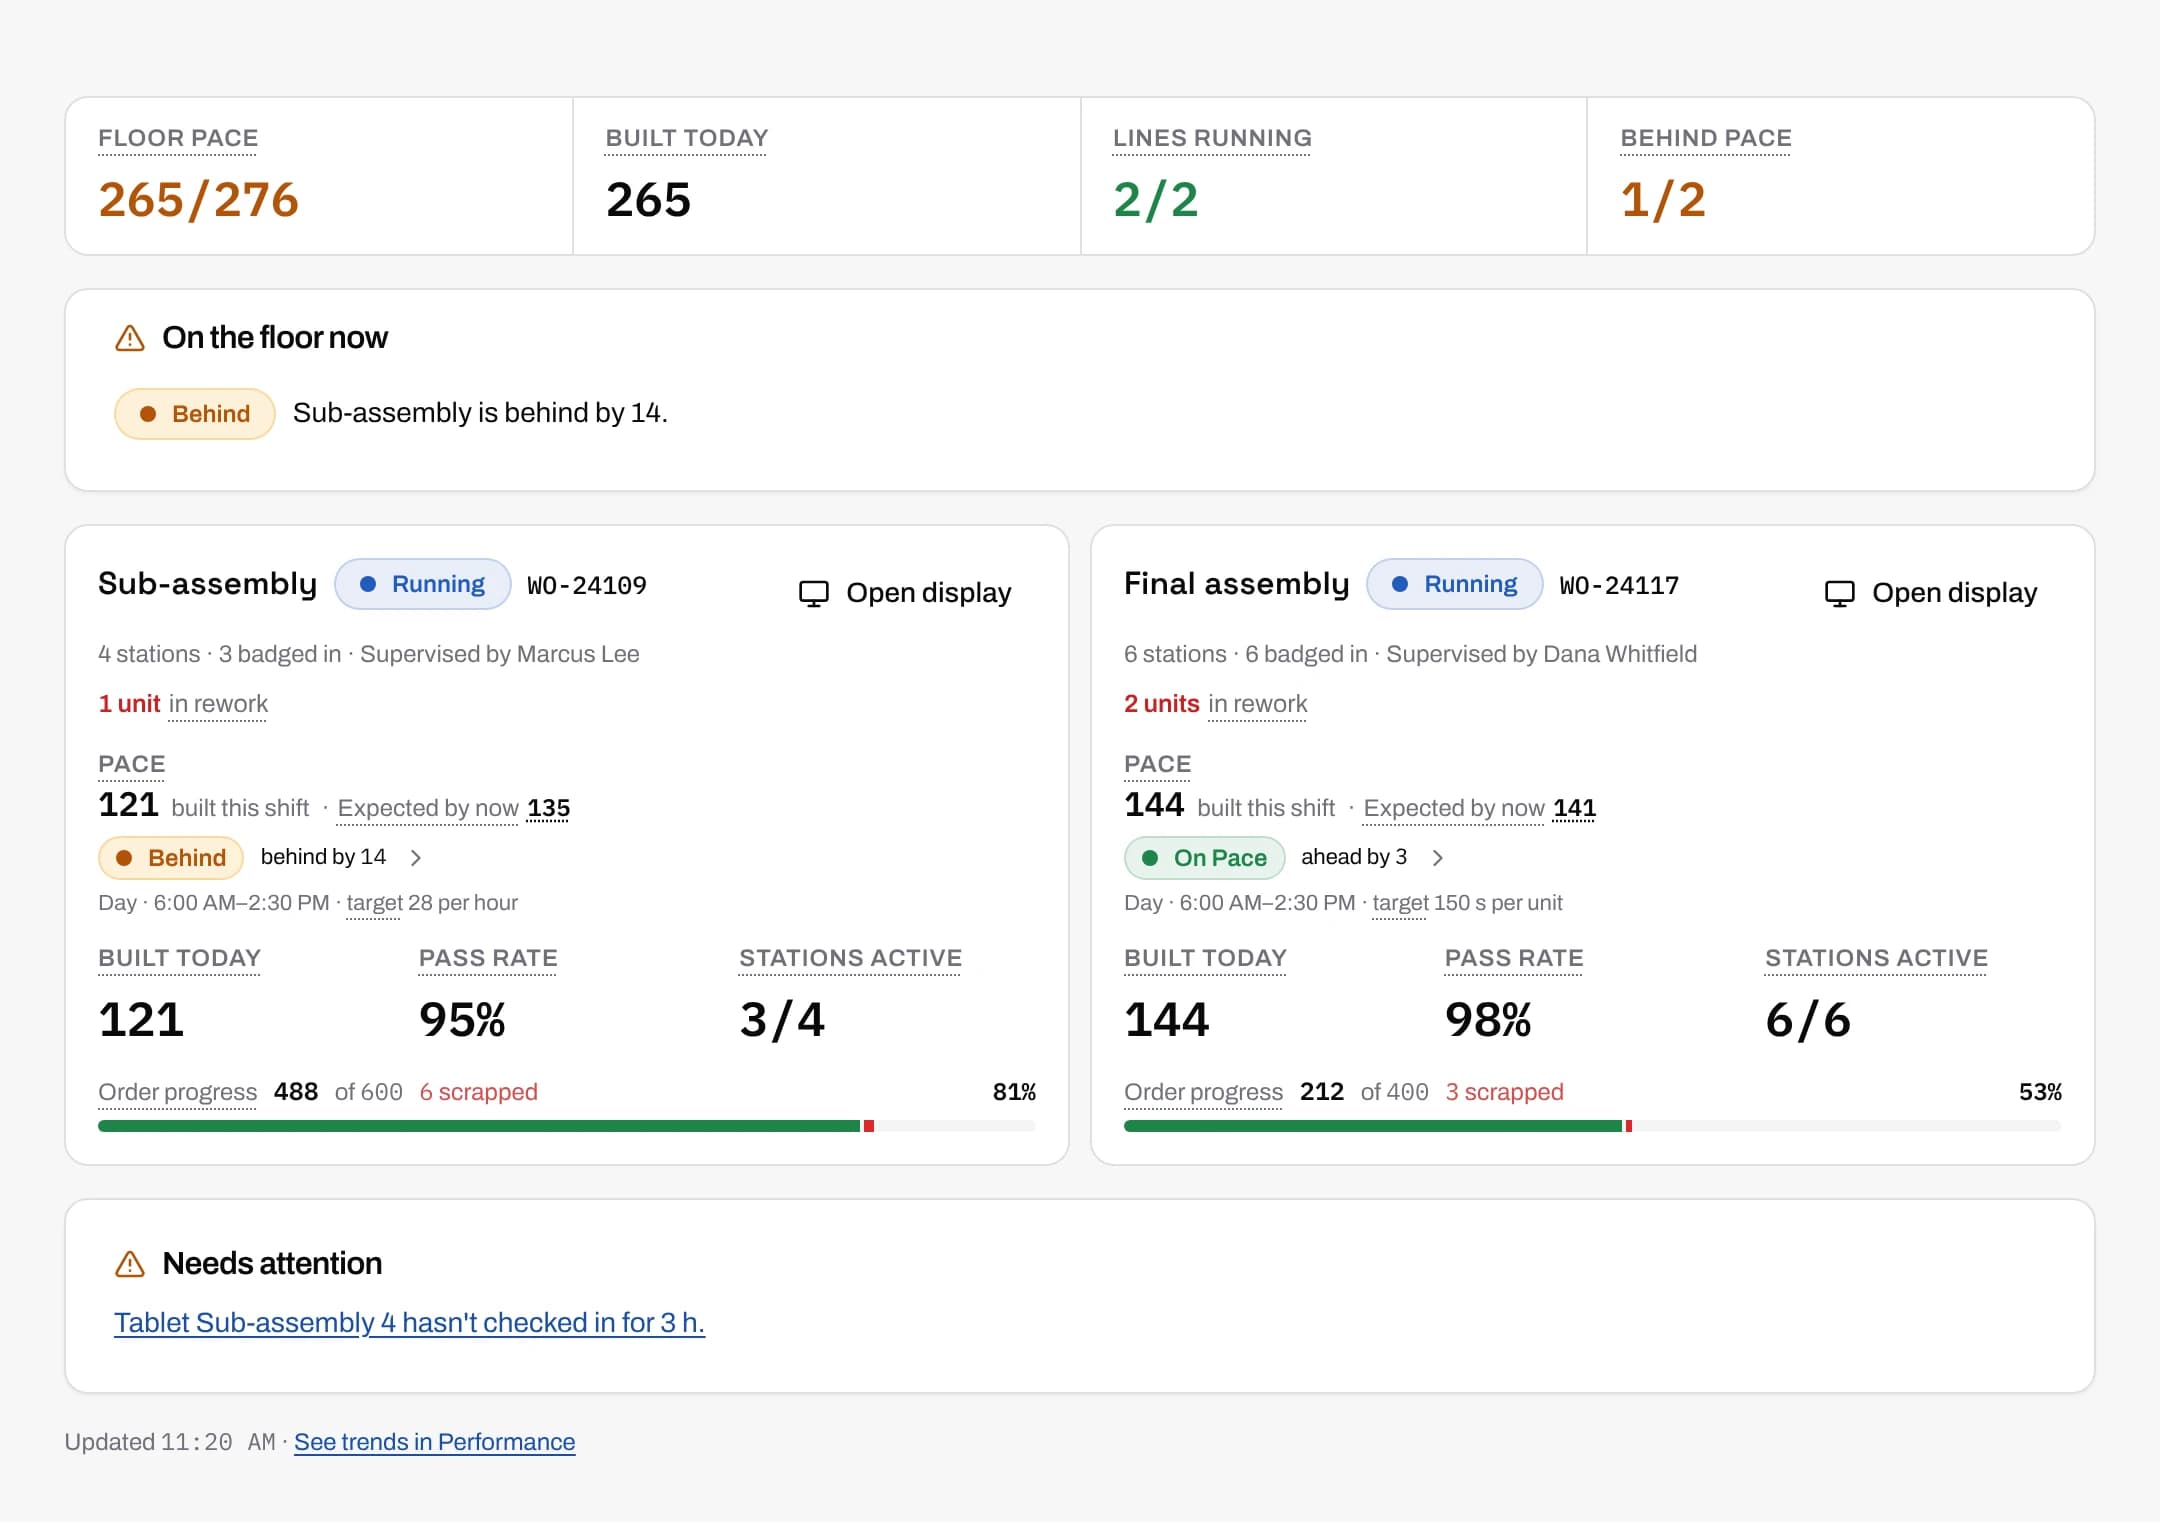
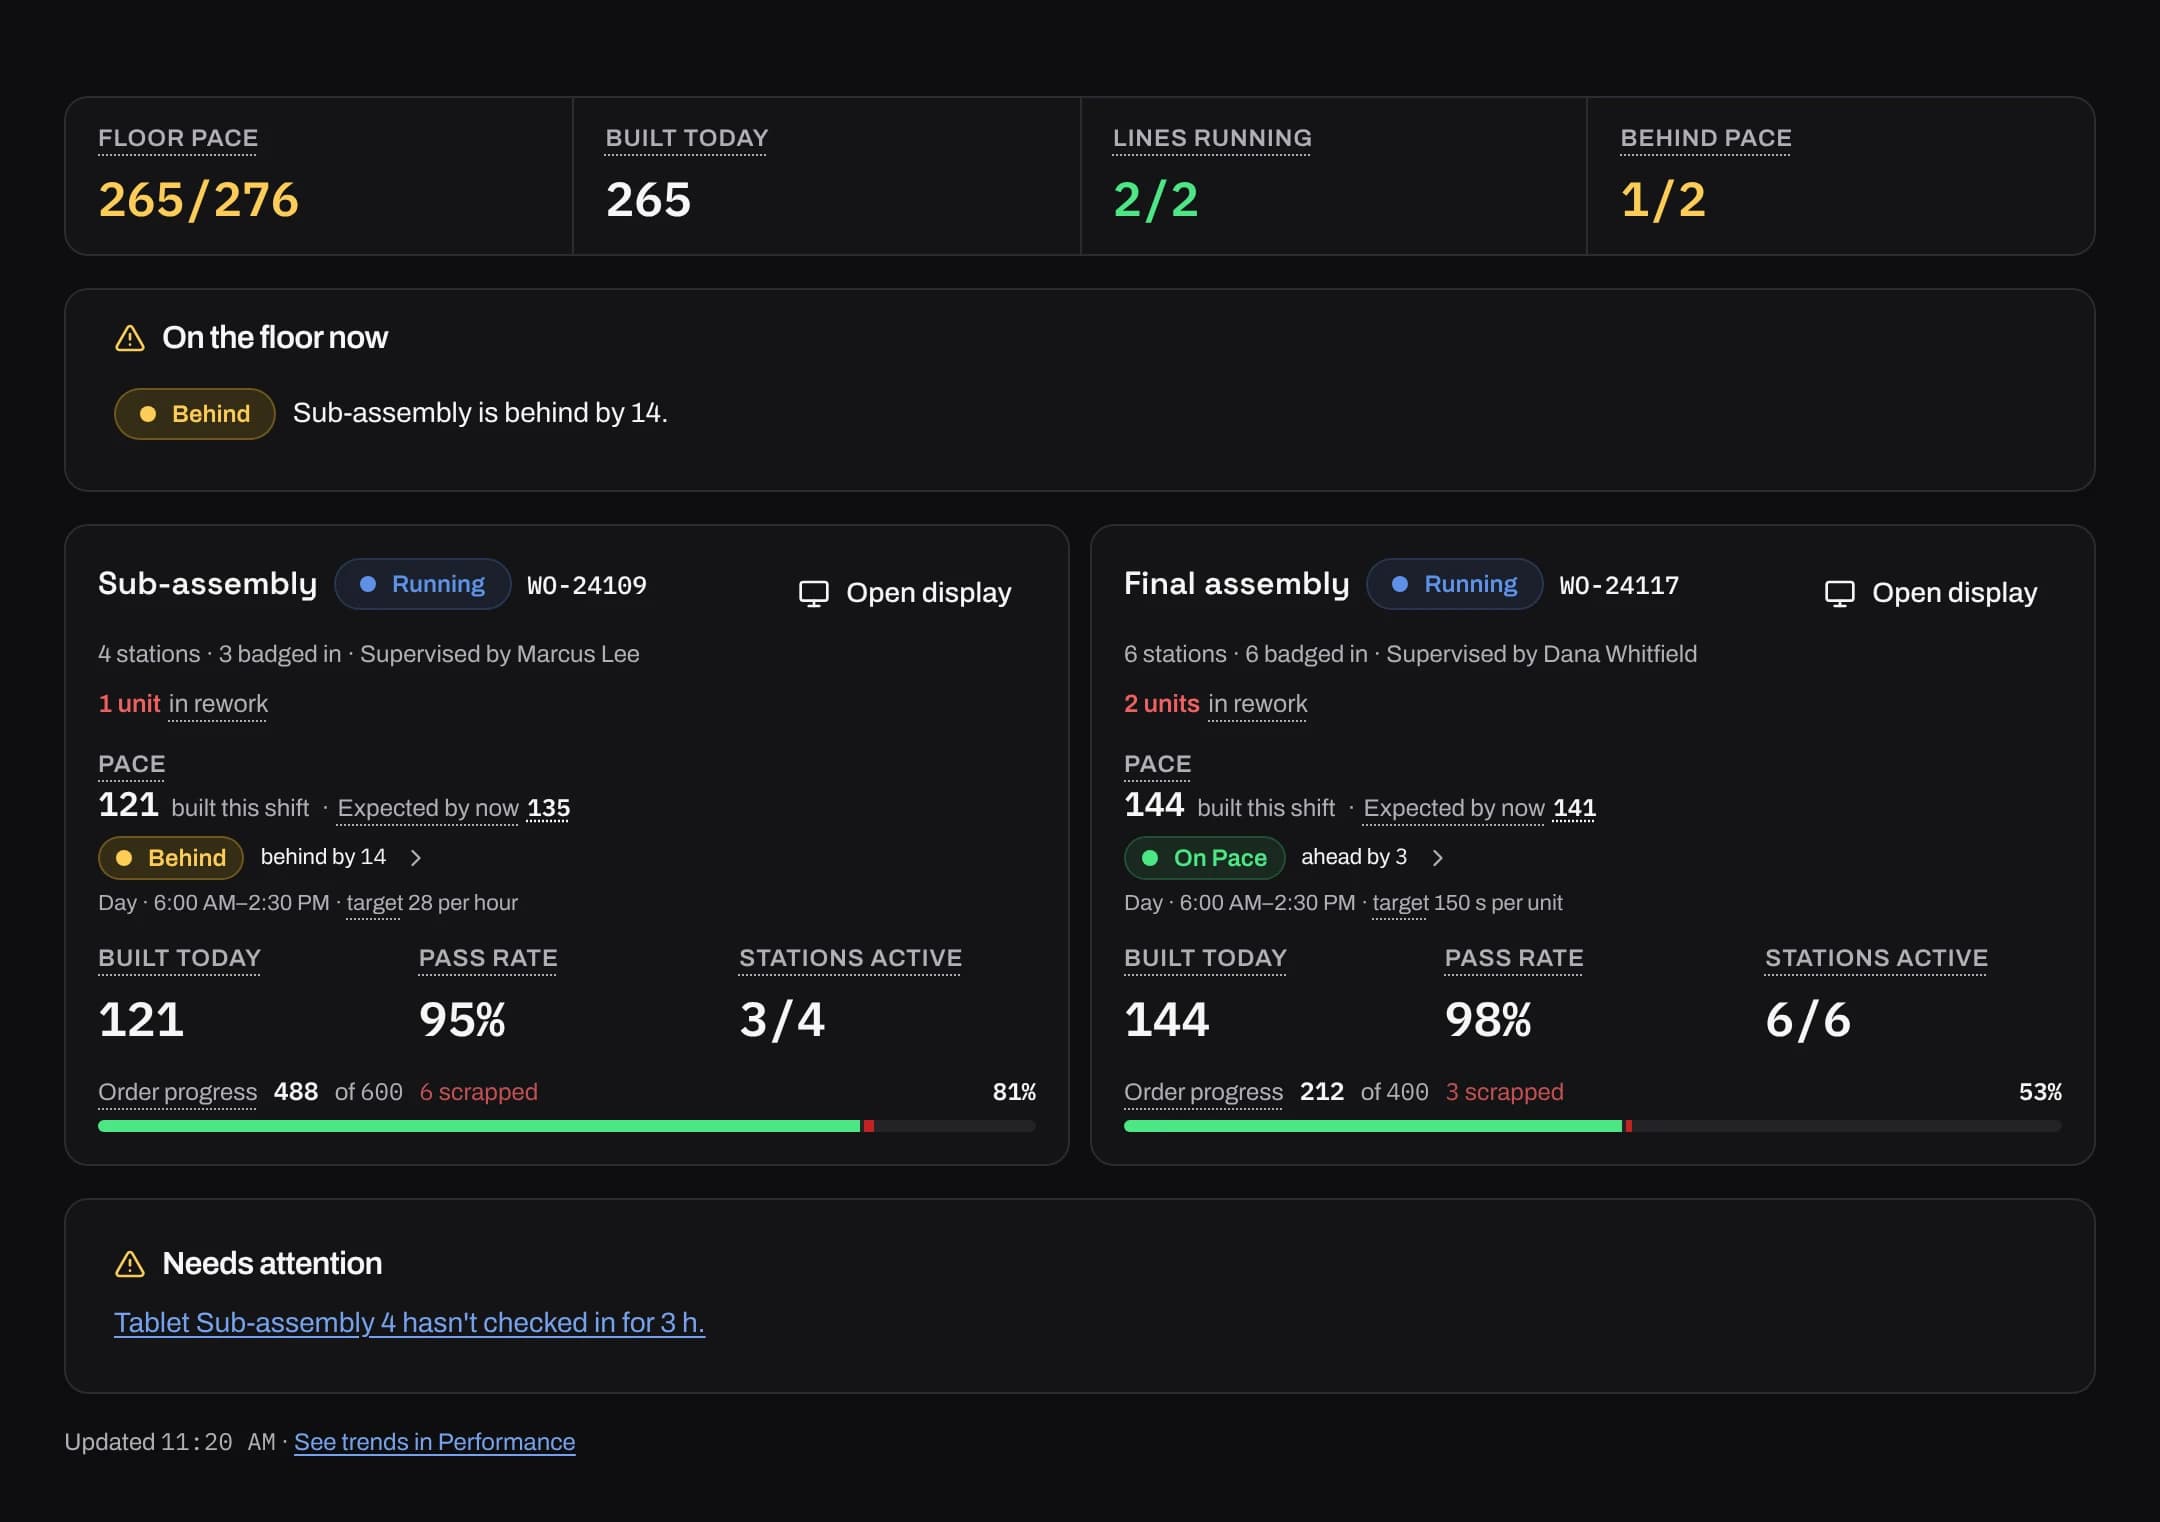
Today is the page a supervisor opens at the start of a shift. Each line has a row: running, paused, idle or not reachable, with its pace, units built today, pass rate and how many stations are active.
Anything that needs a person is listed at the top, with a link to where it gets fixed. A stopped line, a required station with nobody badged in, a line behind pace and an order past its due date all show up there.
From this shift to the last 31 days
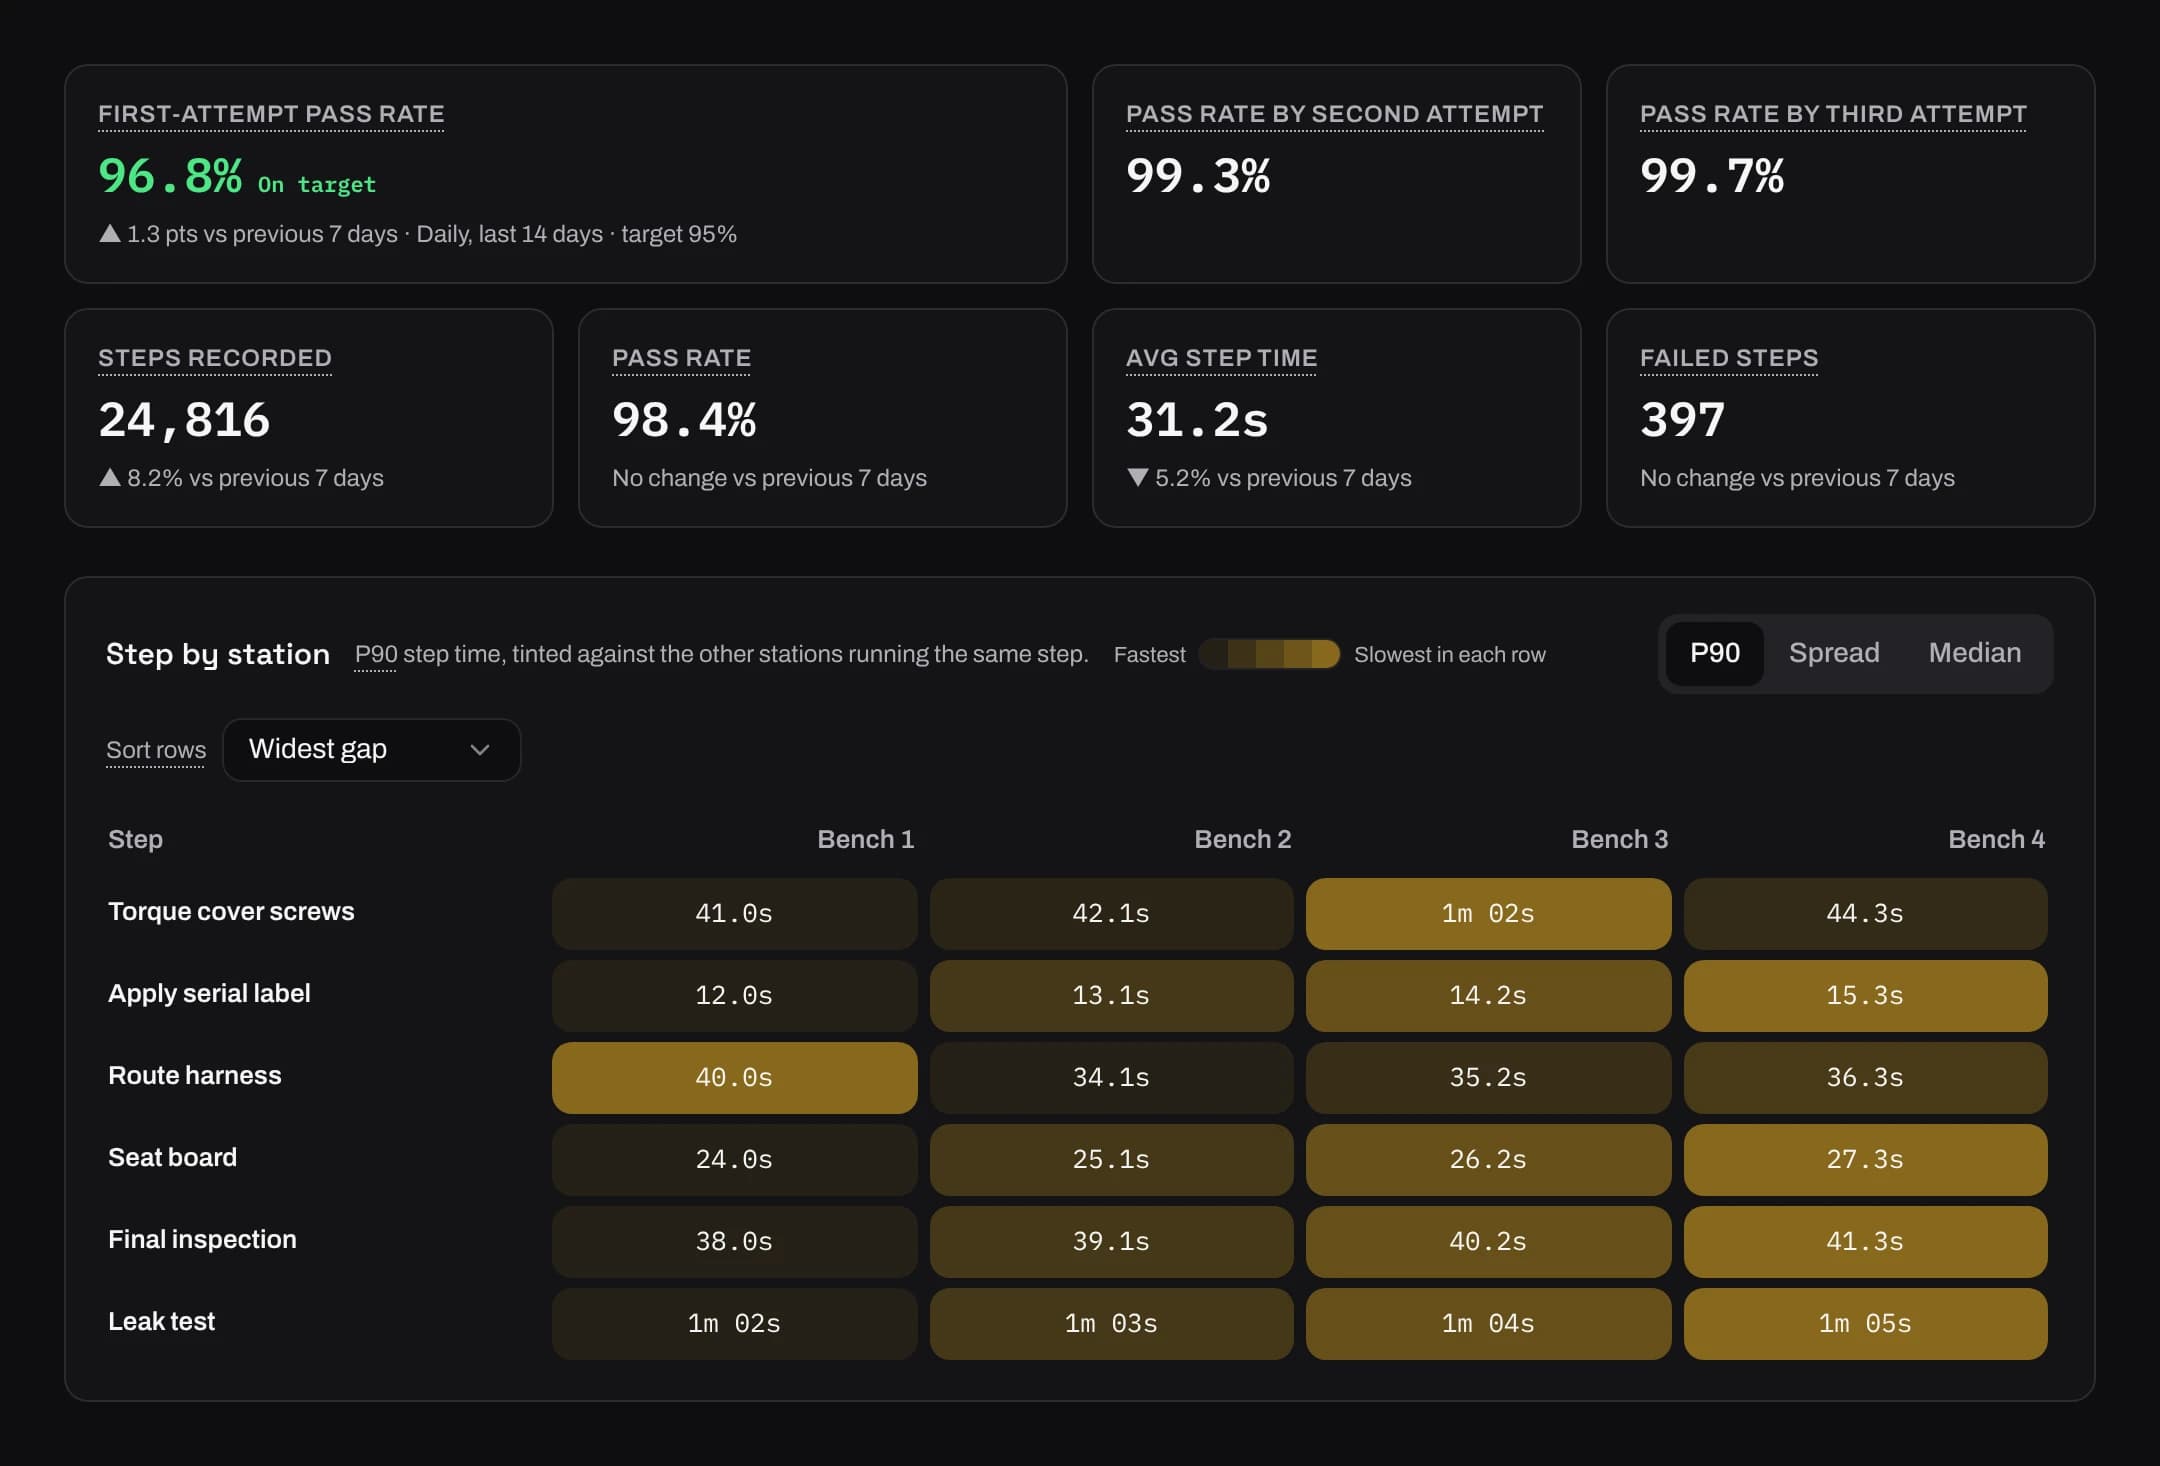
Performance looks back over today, this shift, or the last 7, 14 or 31 days, beside the period before. Group the same records by step, operation, item, model, line, station or failure reason.
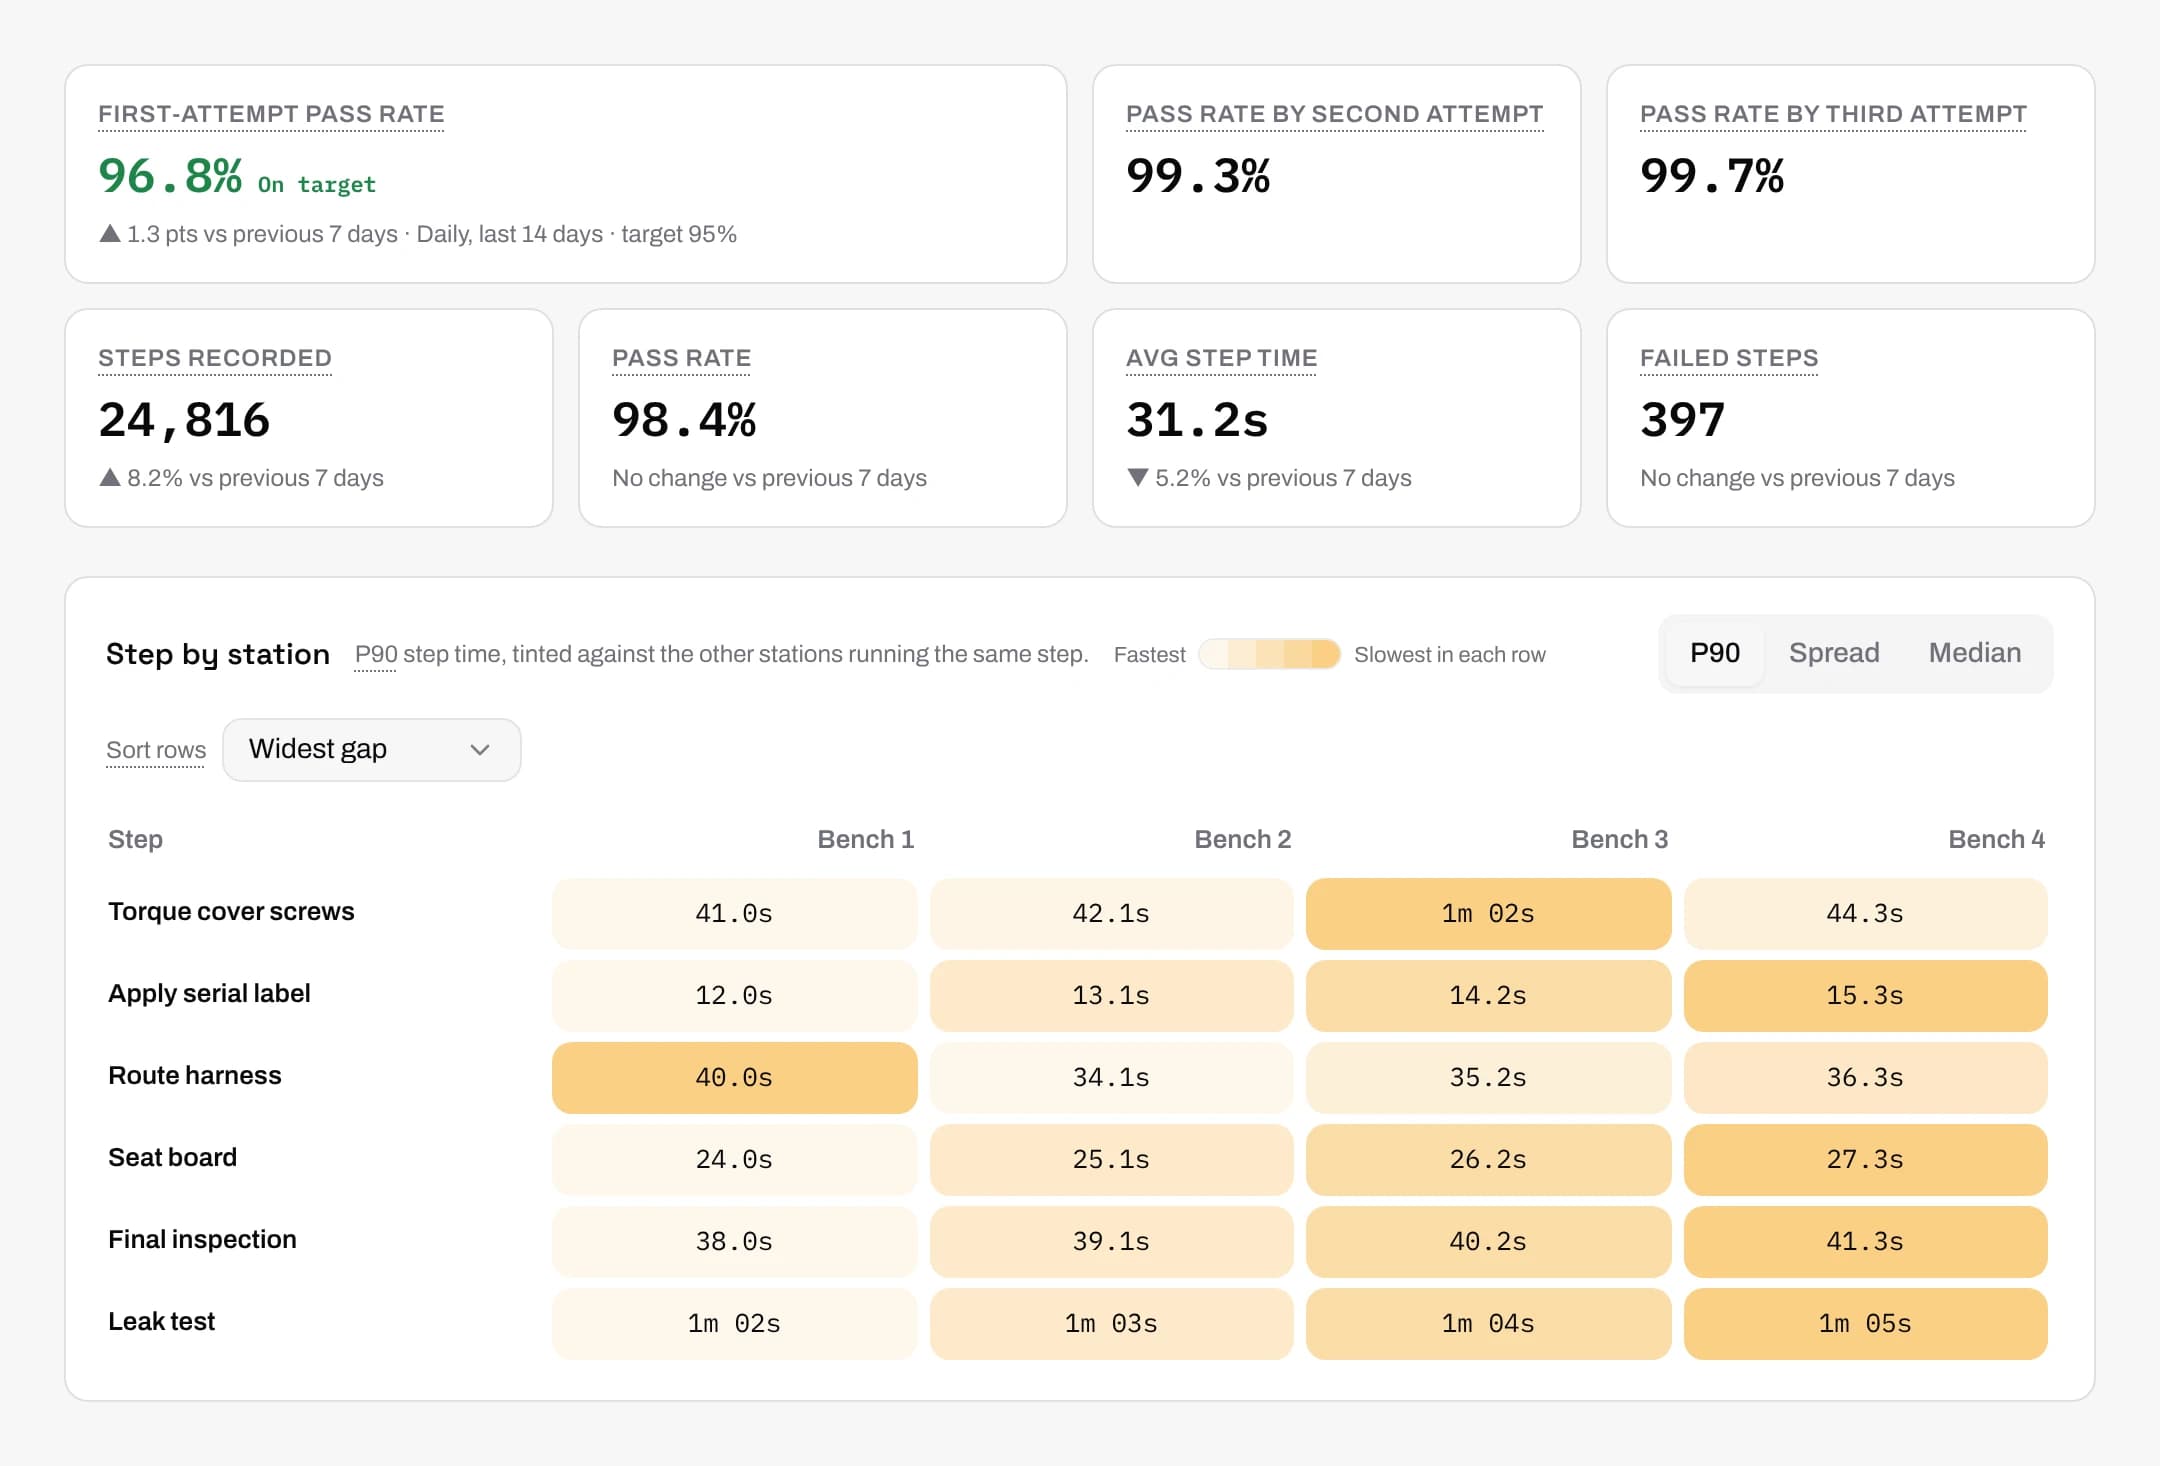
The step by station grid puts the slow spots side by side. Sort it by the widest gap and the steps that differ most between stations come to the top. Every table exports to CSV, and a daily summary can go out by email.
Numbers you can check
Every figure is counted from step records the stations wrote, never typed in after the shift. Each one has a help icon that says exactly what it counts, and days follow your company's time zone.
The dashboards count units. They show who is at a station so a passing supervisor knows who to ask, and they never rank people.
Common questions
What do we need to put a dashboard on the floor?
A TV with a web browser, either built in or from a browser stick, and a network connection. Sign in on the TV with an account that can view analytics and open the line's display.
How often does the line display update?
About every 30 seconds. If a refresh fails, it keeps the last figures on screen and shows when they were last updated.
Does it show OEE?
Not as a single number. The dashboards show pace against your target, first-pass yield, output per hour and units in rework, each counted from the step records.
Can one screen show several lines?
Today shows every line on one page and can be left open on a desk or a screen. Each line display shows one line.
Where do the targets come from?
Settings › Shifts & targets. Set them by hand or import them from a CSV, for a line, a shift, an item or a model.
Start with one line.
Get in touch and we'll set up your first line with you.